Scope
This lab exemplifies practical experience manually digitizing topological a vector dataset, and semi-automatically vectorizing a non-topological dataset.
Software
| Vector Analysis | MIGS |
| Automatic vectorizing | R2V |
| Operating System | Windows NT |
Data Inputs
| Region of Interest | unknown |
| Projection | unknown |
| Image Data | topo.tif |
Method
The flowchart illustrates the process involved in automatic vectorizing of raster imagery for the purpose of this lab, in Gane-Sarson notation. Output maps are attached and outlined at the conclusion of this report.
A note about image cropping: Using command line tools, this step can be automated, which helps, especially in operational environments. The pbmtools, which come with most Linux installations, contain numerous tools for image cropping, rotating, and manipulation, all from a command-line interface. Below is a string of commands to accomplish the extraction of topo.tif. The command converts topo.tif to an intermediary file format, then performs the desired cropping, then outputs to a tiff file once again:
[naboo:/tmp]{25}% tifftopnm topo.tif | pnmcut 1 301 399 319 | pnmtotiff > topo-extract.tif
The usage of "pipes" eliminates the need for storing files on disk during the process.
Analysis
The quality of the resultant vector files appears to be good, especially considering the non-interactive nature of the process. It is difficult to compare the accuracy of this method in comparison to manual and semi-automatic vectorizing processes because the input data is different. However, the loss of human interactivity leaves all responsibility to the program. Manual processes have advantages than this method because users can specify the topological properties of features.
Using the automatic process, such as this exercise, outputs a line file in which all lines have a single line or segment ID. As a result, other users or systems do not know where these lines start/end.
There is a visible difference between the non-smoothed vs. smoothed line files when viewing the FILESTAT reports for both files. The smoothed line file, naturally, contained less total coordinates and total segments. This is because of the 'smoothing' or generalization of lines performed by the smoothing process and tolerance. This is also evident due to the fact that the average distance between coordinates in the smoothed line file is over three times the value of the line file with no smoothing applied. I.e. less line segment definitions are stored with the smoothing process.
XYZ Format Usability
If the .xyz format is or can be linked to another index file within R2V, and if R2V recognizes the pattern of how these line data are stored, then this can be useful. Here is a chunk of .xyz formatted data:
# file test.xyz
78.643216 16.100629 0
80.904523 16.603774 0
80.150754 13.333333 0
82.160804 12.578616 0
83.668342 10.062893 0
83.668342 7.547170 0
81.658291 6.289308 0
78.643216 6.540881 0
76.884422 8.050314 0
The following utility allows the user to copy and paste xyz formatted data, specifying the output width and height of the image, and attempts to plot the file on the fly.
One cannot see from the output that all lines are connected to each other, i.e. the software does not how or when to end or start line segments. This data, on its own, does not contain any connectedness, adjacency or contiguity (i.e. no topological relationships).
For example, the Idrisi system stores line files such that endpoints of lines are represented by a 0 0 value.
# file line.vec
1 3
1 4
1 5
1 8
0 0
This type of file format, especially when documented, is more useful for issues of interoperability. Perhaps the most intuitive, efficient and portable format for such data is that of Geography Markup Language (GML), which is an XML encoding of geographic feature data in a self-describing method, based on well-known public schemas. Below is a chunk of GML representing a line:
<LineString srsName="http://www.opengis.net/gml/srs/epsg.xml#4326">
  <coord>
    <X>0.0</X>
    <Y>0.0</Y>
  </coord>
  <coord>
    <X>20.0</X>
    <Y>35.0</Y>
  </coord>
  <coord>
    <X>100.0</X>
    <Y>100.0</Y>
  </coord>
</LineString>
...resulting in a portable, interoperable data format.
As a result, the .xyz file may or may not be a useful line file, depending on the context. While it does contain coordinate information, which can be plotted, it does not have any connectivity information about the line segments themselves, which can prove confusing, especially to non-native systems and processes.
Attached: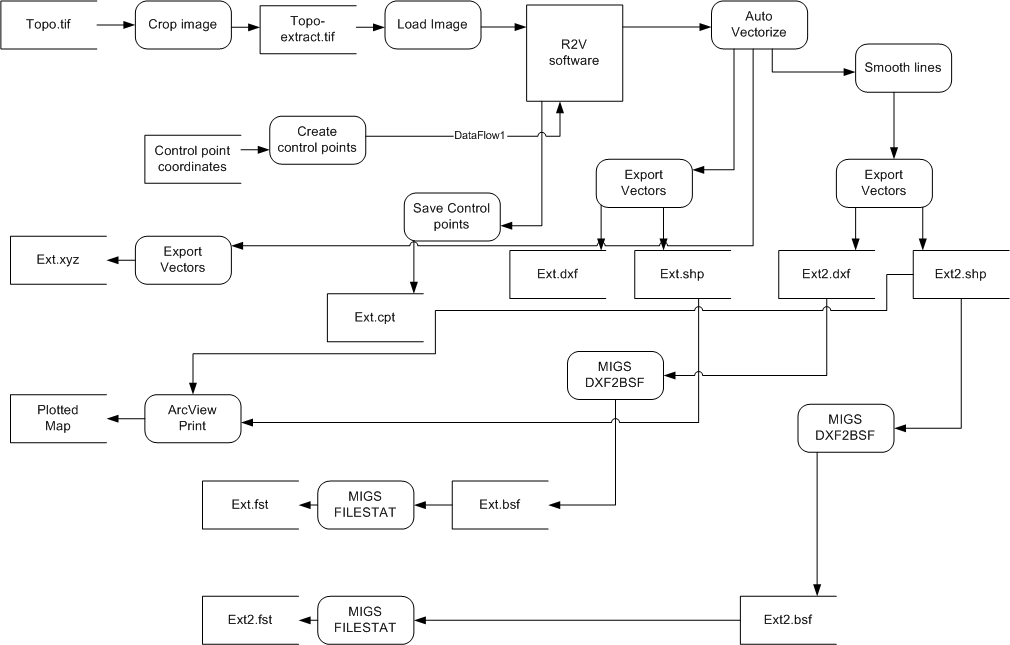